
Can You Box the Letters?
The New York Times has a game in which you navigate between letters around a square, never visiting the same side twice in a row. How many paths can you make through all the letters?

Welcome to Fiddler on the Proof! The Fiddler is the spiritual successor to FiveThirtyEight’s The Riddler column, which ran for eight years under the stewardship of myself and Ollie Roeder.
Each week, I present mathematical puzzles intended to both challenge and delight you. Puzzles come out Friday mornings (8 a.m. Eastern time). Most can be solved with careful thought, pencil and paper, and the aid of a calculator. The “Extra Credit” is where the analysis typically gets hairy, or where you might turn to a computer for assistance.
I’ll also give a shoutout to 🎻 one lucky winner 🎻 of the previous week’s puzzle, chosen randomly from among those who submit their solution before 11:59 p.m. the Monday after that puzzle was released. I’ll do my best to read through all the submissions and give additional shoutouts to creative approaches or awesome visualizations, the latter of which could receive 🎬 Best Picture Awards 🎬.
This Week’s Fiddler
In the game of Letter Boxed from The New York Times, you must connect letters together around a square to spell out words. However, from any given letter, the next letter cannot be on the same side of the square.
Consider the following diagram, which consists of eight points (labeled A through H), two on each side of the square. A valid “letter boxed” sequence starts at any of the eight points, and proceeds through all of the other points exactly once. However, adjacent points in the sequence can never be on the same side of the square. The first and last points in the sequence can be on the same side, but do not have to be.
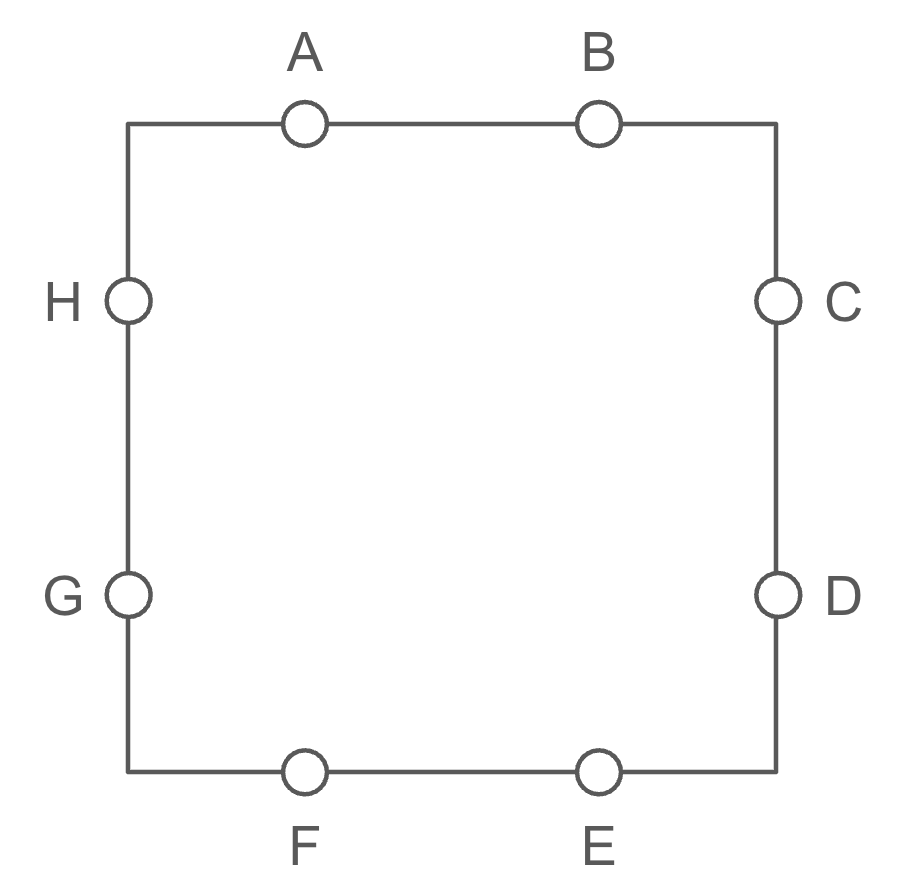
As an illustration, AFBCHEDG is a valid sequence of points. However, AFBCHGED is not a valid sequence, since H and G are adjacent in the sequence and on the same side of the square.
How many distinct valid “letter boxed” sequences are there that include all eight points on the square?
This Week’s Extra Credit
Instead of two points on each side of the square (and eight points in total), now there are three points on each side (and twelve points in total), labeled A through L in the diagram below.
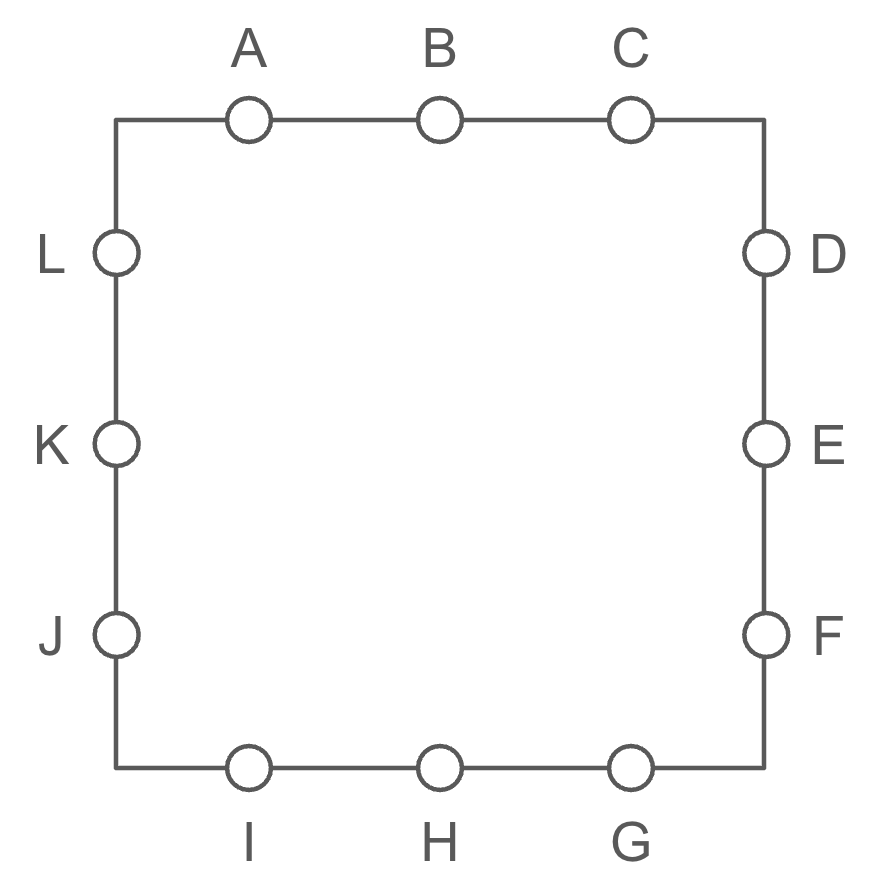
How many distinct valid “letter boxed” sequences are there that include all 12 points on the square?
Making the ⌊Rounds⌉
There’s so much more puzzling goodness out there, I’d be remiss if I didn’t share some of it here. This week, I’m sharing the news that Chat-GPT will be joining the friendly Fiddler competition.
I’ve been playing with the various LLMs as they’ve been released. OpenAI’s GPT-5 Reasoning has done some impressive work when it comes to solving Fiddlers. Therefore, I will be adding one or more LLMs (including GPT-5 Reasoning) to the leaderboard in the coming weeks. You know, as a benchmark for us poor, lowly humans.
I’ll being doing this retroactively, posing to the LLMs all the puzzles from Q3 so far. Stay tuned!
Want to Submit a Puzzle Idea?
Then do it! Your puzzle could be the highlight of everyone’s weekend. If you have a puzzle idea, shoot me an email. I love it when ideas also come with solutions, but that’s not a requirement.
Standings
I’m tracking submissions from paid subscribers and compiling a leaderboard, which I’ll reset every quarter. All correct solutions to Fiddlers and Extra Credits are worth 1 point each. Solutions should be sent prior to 11:59 p.m. the Monday after puzzles are released. At the end of each quarter, I’ll 👑 crown 👑 the finest of Fiddlers. If you think you see a mistake in the standings, kindly let me know.
Last Week’s Fiddler
Congratulations to the (randomly selected) winner from last week: 🎻 Jonathan Schwartz 🎻 from Campbell, California. I received 58 timely submissions, of which 43 were correct—good for a 74 percent solve rate.
Last week, you were playing a game of “high-low,” which proceeded as follows:
First, you were presented with a random number, x1, which was between 0 and 1.
A new number, x2, was about to be randomly selected between 0 and 1, independent of the first number. But before it was selected, you had to guess how x2 would compare to x1. If you thought x2 would be greater than x1, you guessed “high.” If you thought x2 would be less than x1, you guessed “low.” If you guessed correctly, you earned a point and advanced to the next round. Otherwise, the game was over.
If you correctly guessed how x2 compared to x1 then another random number, x3, would be selected between 0 and 1. This time, you had to compare x3 to x2, guessing whether it would be “high” or “low.” If you guessed correctly, you earned a point and advanced to the next round. Otherwise, the game was over.
You continued playing as many rounds as you could, as long as you kept guessing correctly.
You quickly realized that the best strategy was to guess “high” whenever the previous number was less than 0.5, and “low” whenever the previous number was greater than 0.5.
With this strategy, what was the probability you would earn at least two points? That is, what were your chances of correctly comparing x2 to x1 and then also correctly comparing x3 to x2?
First, let’s analyze your chances of correctly comparing x2 to x1. Since x1 and x2 were both uniformly distributed between 0 and 1, you could represent all possible pairs of them as points in the unit square whose x-coordinates represented x1 and whose y-coordinates represented x2. When x1 was between 0 and 0.5, you guessed “high” and won the round as long as x2 was actually greater than x1. And when x1 was between 0.5 and 1, you guessed “low” and won the round as long as x2 was actually less than x1. The diagram below, courtesy of solver Michael Schubmehl, shows these winning regions in the unit square.
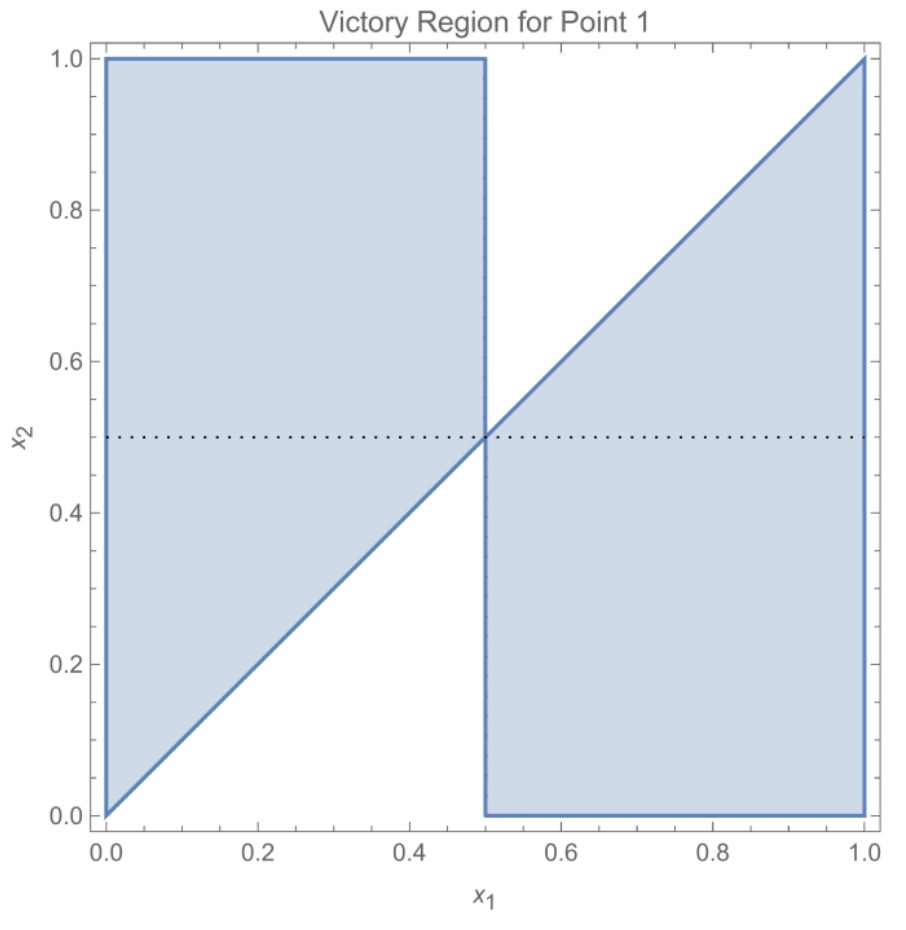
Your probability of winning the round was the combined area of the blue regions divided by the total area of the unit square, which was 1. Therefore, your probability of winning the first round was 3/4, or 0.75.
At this point, it was tempting to think that you had a 75 percent chance of winning any round in the game. This assumed the rounds were independent of each other. If that were true, your chances of winning both of the first two rounds would have been (0.75)2, or 56.25 percent.
However, the rounds were not independent of each other! One way to see this was to assume you made it to the second round. What was the distribution of x2? Was it uniformly distributed between 0 and 1, as x1 was?
No, it was not. If you look more closely at the winning regions for the first round in the diagram above, you’ll note that some values of x2 (the y-coordinate) are better represented than others. In particular, values close to 0 and 1 only show up about half as often as values close to 0.5. For example, when x2 was very close to 0, you only won half the time—when you guessed “under” in the first round. But when x2 was, say 0.49, you almost always won—when you guessed “over” if x1 was between 0 and 0.49 and when you guessed “under” if x1 was greater than 0.5. And so, because of your strategy in the first round, if you won that first round, you were more likely to encounter middle-of-the-road values (i.e., closer to 0.5 and farther from the extremes of 0 and 1) in x2. The precise formula for the relative density of x2 here was 1 − |x2−0.5|.
Now guessing in “high-low” was easier when you were presented with a more extreme number. If you were presented with 0.01 in a given round, there was a 99 percent chance you’d win that round by guessing “high.” But if you were presented with 0.5, there was only a 50 percent chance you’d win that round. Numbers in the middle made it tougher. So because x2 was more clustered around 0.5 than x1 had been, the second round was likely to be tougher than the first.
But to solve last week’s Fiddler, you had to compute your chances of winning this second round. This was equal to the probability density for x2 (given that you won the first round), plotted above, multiplied by your probability of winning given that value of x2, which was max(x2, 1−x2), or 0.5 + |x2−0.5|.
(Technically, there was no need to normalize the distribution for x2, since the area under the curve was 0.75, precisely your probability of winning the first round.)
Your probability of winning the first two rounds could be represented by the following integral:
Since both functions inside the integral were symmetric across x = 0.5, you only had to integrate the region between 0 and 0.5 and then double it. That integral was of the function (1/2+x)·(1−x), which was decidedly friendlier. Evaluating from 0 to 0.5 and doubling gave you the crisp answer of 13/24, or about 54.2 percent, the answer to last week’s Fiddler.
We already said the probability of winning the first round was 75 percent. Given that you won the first round, your probability of winning the second round was (13/24)/(3/4), which simplified to 13/18, or about 72.2 percent. As predicted, this was less than 75 percent! Your probability of winning each subsequent round continued decreasing as the probability distribution for the numbers clustered closer and closer to 0.5. But what value these probabilities converged toward was a matter for the Extra Credit.
Last Week’s Extra Credit
Congratulations to the (randomly selected) winner from last week: 🎻 David P. Combs 🎻 from Palm Springs, California. I received 40 timely submissions, of which 23 were correct—good for a 57.5 percent solve rate. This was a tough one!
Your friend was playing an epic game of “high-low” and made it incredibly far, having racked up a huge number of points.
Given this information, and only this information, what was the probability that your friend would win the next round of the game?
