
Can You Tile the Hexagon?
My kitchen floor is made up of many equilateral triangles. How many distinct ways can I tile it using rhombuses that are composed of two such triangles?

Welcome to Fiddler on the Proof, the spiritual successor to FiveThirtyEight’s The Riddler column.
Every Friday morning, I present mathematical puzzles intended to challenge and delight you. Most can be solved with careful thought, pencil and paper, and the aid of a calculator. The “Extra Credit” is where the analysis typically gets hairy, or where you might turn to a computer for assistance.
I’ll also give a shoutout to 🎻 one lucky winner 🎻 of the previous week’s puzzle, chosen randomly from among those who submit their solution before 11:59 p.m. the Monday after puzzles are released. I’ll do my best to read through all the submissions and give additional shoutouts to creative approaches or awesome visualizations, the latter of which could receive 🎬 Best Picture Awards 🎬.
This Week’s Fiddler
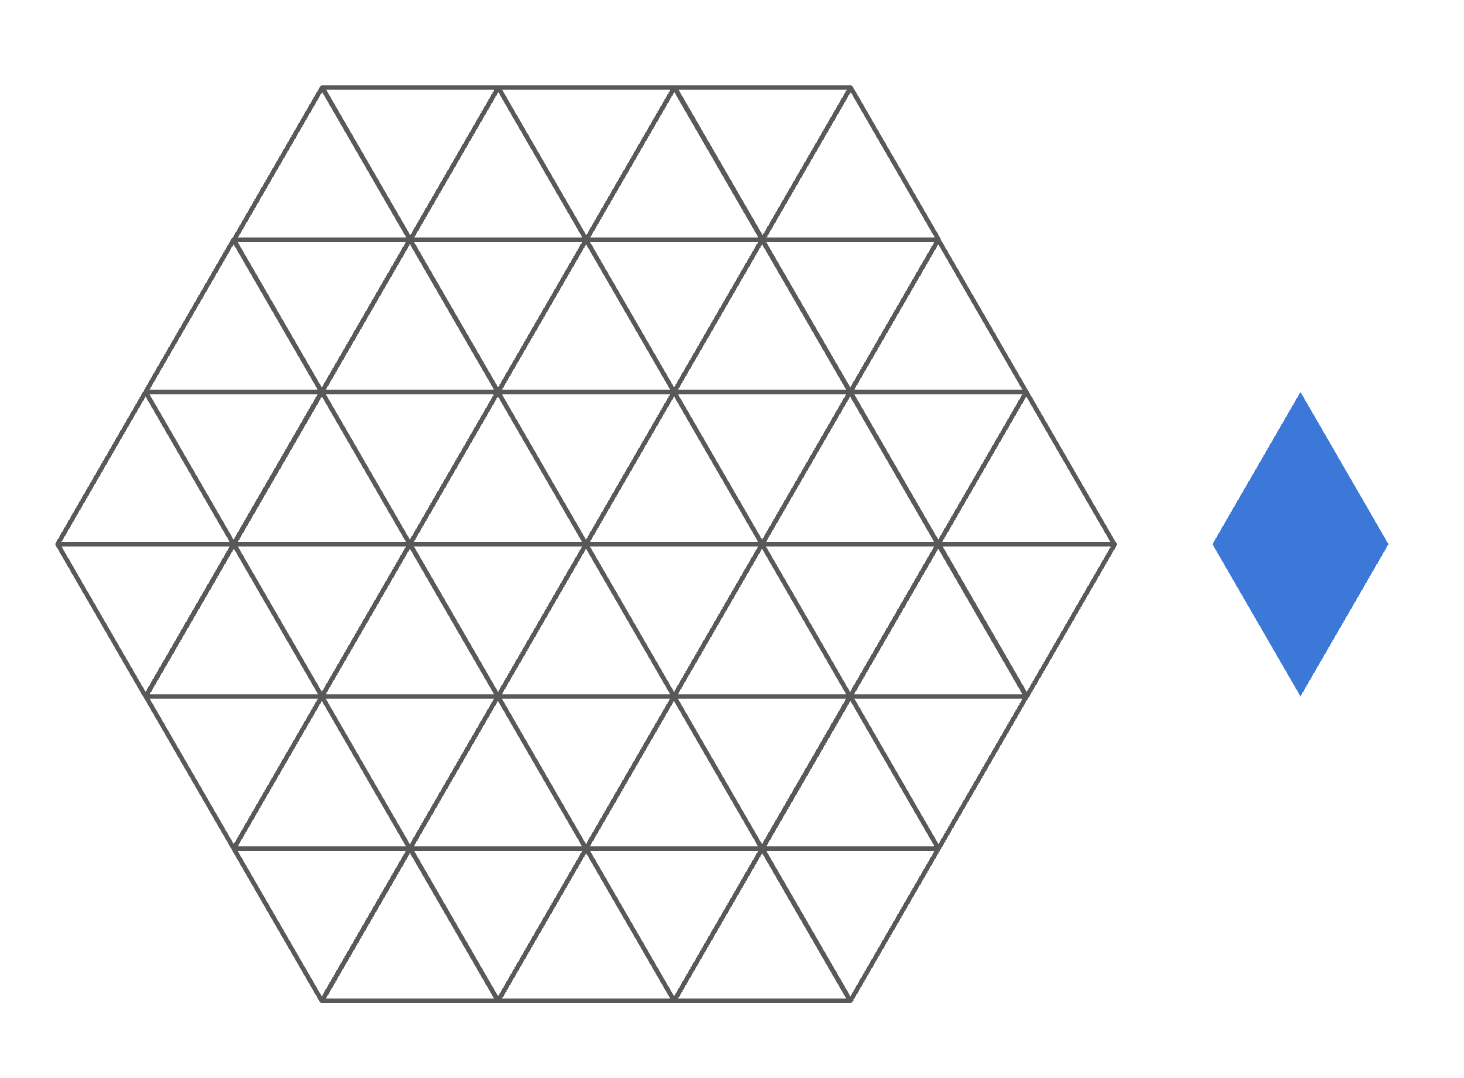
I’m redoing my kitchen floor using rhombus-shaped tiles composed of two congruent equilateral triangles. One such tile is shown in blue below. How many distinct ways can I use these to tile the outlined region below, which consists of 24 equilateral triangles arranged in a regular hexagon?

This Week’s Extra Credit
I’m also redoing my patio, using similar rhombus-shaped stones. How many distinct ways can I tile the outlined region below, which consists of 54 equilateral triangles?
Making the ⌊Rounds⌉
There’s so much more puzzling goodness out there, I’d be remiss if I didn’t share some of it here. This week, I’m sharing—courtesy of reader Henry Huang—a story by Greg Egan that I haven’t yet in its entirety. But I got far enough to encounter some of the great puzzles that caught Henry’s attention, such as this one (among many delectable choices):
Can you find an integer … whose reciprocal has a recurring decimal with ten repeating digits, all of them different?
Want to Submit a Puzzle Idea?
Then do it! Your puzzle could be the highlight of everyone’s weekend. If you have a puzzle idea, shoot me an email. I love it when ideas also come with solutions, but that’s not a requirement.
Standings
I’m tracking submissions from paid subscribers and compiling a leaderboard, which I’ll reset every quarter. All correct solutions to Fiddlers and Extra Credits are worth 1 point each. Solutions should be sent prior to 11:59 p.m. the Monday after puzzles are released. At the end of each quarter, I’ll 👑 crown 👑 the finest of Fiddlers. If you think you see a mistake in the standings, kindly let me know.
Last Week’s Fiddler
Congratulations to the (randomly selected) winner from last week: 🎻 Reid 🎻 from Kansas City. I received 50 timely submissions, of which 31 were correct—good for a 62 percent solve rate.
Last week, I was concerned that the random number generator on my calculator might have been malfunctioning.
Under normal conditions, it should have generated random numbers between 0 and 1. But my suspicion was that the calculator was “tanked,” meaning it only generated random numbers between 0 and some value 0 < a < 1. Beyond that, I had no knowledge regarding the value of a; it was equally likely to be any value from 0 to 1.
As an experiment, I asked the calculator to generate one random number. It produced a value of exactly 0.5. (While this was, admittedly, infinitely unlikely, I asked you to roll with it!)
Based on this result, what could I have expected the value of a to be, on average?
First off, whoever heard of “tanking” a calculator? That’s not a thing. “Bricking” would have made more sense. Ah, but this was a subtle nod to the famed German tank problem, a discrete problem that was analogous to last week’s continuous one.
In any case, we knew a couldn’t be less than 0.5. If it had been, then it would have been impossible for the calculator to produce a value of 0.5! Thus, we had the restriction that 0.5 ≤ a < 1.
At this point, it was tempting to conclude that any value of a within this range was equally likely, and that the answer was therefore 3/4, or 0.75. Indeed, quite a few readers submitted this answer. However, 0.75 wasn’t quite right.
Given a particular value of a, the calculator produced a random value x with 0 < x < a, which meant the uniform probability density in this region was p(x) = 1/a. Thus, the smaller the value of a, the greater the probability density function. Using a Bayesian approach, the probability for any particular value of a was then proportional to 1/a.
Let’s pause and think about this for a minute. Instead of saying the calculator gave you an exact value of 0.5, suppose it was within some very small range, like between 0.499 and 0.501. If a was 1, then the probability a random number would have fallen in this range was (0.501−0.499)/1, or 2/1000. But if a was smaller—say, 0.501—then the probability a random number would have fallen in this range was (0.501−0.499)/0.501, or 2/501. That was almost twice as likely!
So the probability for a given value of a was proportional to 1/a, and a could be anywhere between 0.5 and 1. To compute the expected value of a, you had to integrate this density, weighted by each value of a, and normalize:
The numerator was equal to 0.5, while the denominator was equal to ln(2). Thus, the average was 1/(2ln(2)), or approximately 0.72135. Sure enough, it was not 0.75; rather, it was less than 0.75, which made sense given how we expected smaller values of a to be favored.
If you’re still not convinced, you can confirm this result via simulations! As an illustration, I ran 1 million simulations in which I first picked a random value for a with 0 < a < 1 and then a random value for x with 0 < x < a. Among the 1 million simulations, 1378 resulted in a value of x between 0.499 and 0.501. The histogram below shows the distribution for a among these 1378 simulations:
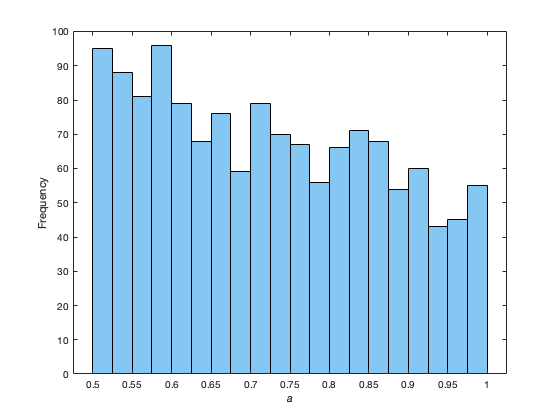
You can clearly see the downward trend (although it’s harder to tell that this is hyperbolic rather than linear), and that values of a close to 1 were about half as common as values of a close to 0.5.
Last Week’s Extra Credit
Congratulations to the (randomly selected) winner from last week: 🎻 Christian Robert 🎻 from Paris, France. I received 38 timely submissions, of which 24 were correct—good for a 63 percent solve rate.
Frustrated with my old calculator, I tossed it in the trash recycling bin and bought a new one. But now I was concerned this second calculator was also “tanked.” As before, every value of a between 0 and 1 was equally likely (initially).
I asked my friend to generate one random number using this second calculator. My friend did so, and smirked. “I won’t tell you what the number is,” my friend said, “but it’s somewhere between 0 and 0.5.”
On average, what could I now have expected the value of a (for this second calculator) to be?
