
Camp Algebra
Welcome to a fiendish numerical triathlon. Can you decode the trophy?

Welcome to Fiddler on the Proof, the spiritual successor to FiveThirtyEight’s The Riddler column.
Every Friday morning, I present mathematical puzzles intended to challenge and delight you. Most can be solved with careful thought, pencil and paper, and the aid of a calculator. The “Extra Credit” is where the analysis typically gets hairy, or where you might turn to a computer for assistance.
I’ll also give a shoutout to 🎻 one lucky winner 🎻 of the previous week’s puzzle, chosen randomly from among those who submit their solution before 11:59 p.m. the Monday after puzzles are released. I’ll do my best to read through all the submissions and give additional shoutouts to creative approaches or awesome visualizations, the latter of which could receive 🎬 Best Picture Awards 🎬.
This Week’s Fiddler
This week’s Fiddler is a little different. It’s a puzzle in the style of the MIT Mystery Hunt rather than a mathematical brainteaser, although there’s certainly some math involved. The puzzle originally ran in a game-centric special edition of the Financial Times this past Saturday (edited by the one-and-only Ollie Roeder!). There will be no Extra Credit this week.
I am reproducing the puzzle below. You can also see it in its original form over at the Financial Times—but if you do, please refrain from looking up the solution.
Camp Algebra
Camp Algebra held a competition in which campers were split into two teams: the Aces and the Ciphers. Various members of these teams competed in a triathlon of chess, basketball, and baseball. The results are shown below. To commemorate the event, the camp counselors designed a cuboidal trophy with dimensions that cleverly related to the results of the three events. Then, being Camp Algebra after all, they computed the square of the shortest path along the trophy’s surface from one corner to the opposite corner. After decoding that number, namely, what camp mascot did they carve into the trophy?
Chess
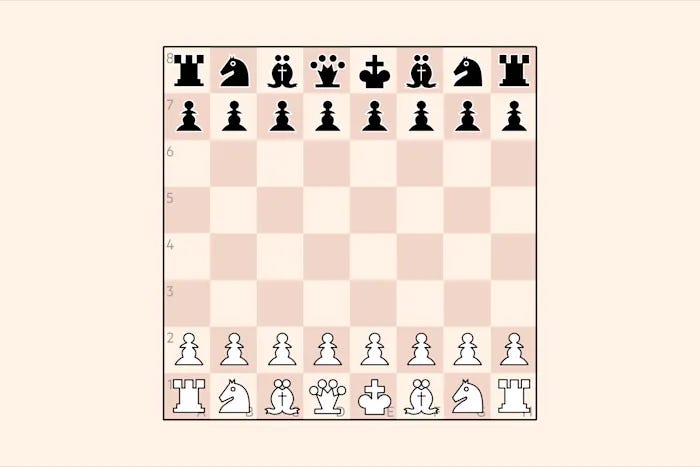
Occupatus, playing as white for the Aces, had Castor, playing as black for the Ciphers, on the ropes. But the industrious Castor clearly gave a dam. With what next move did Castor turn the tables?
Basketball
The Aces crushed the Ciphers in the second competition. While the box score showed all the players’ names in order, it neglected to tally the two teams’ scores bit by bit. (Statistics are minutes, rebounds, assists, steals, blocks, total field goals, 3-point field goals and free throws.)
Baseball
In the final event, the Aces narrowly defeated the Ciphers, 5-4. But whatever did the scoreboard look like? Surely both line-ups had something to say about that.
Making the ⌊Rounds⌉
There’s so much more puzzling goodness out there, I’d be remiss if I didn’t share some of it here. This week, I’m sharing a few other puzzles from the Financial Times’ special edition:
Killer grids: logical detective puzzles. Nail the killers at the picnic and the library.
Hexwords: a game of tactical vocabulary. Outspell and outflank in this alphabetical twist on a two-player, game-theory classic.
State of the nation: a jumbo American crossword. Solve this Texas-sized puzzle — then solve its nationwide meta-puzzle.
Want to Submit a Puzzle Idea?
Then do it! Your puzzle could be the highlight of everyone’s weekend. If you have a puzzle idea, shoot me an email. I love it when ideas also come with solutions, but that’s not a requirement.
Standings
I’m tracking submissions from paid subscribers and compiling a leaderboard, which I’ll reset every quarter. All correct solutions to Fiddlers and Extra Credits are worth 1 point each. Solutions should be sent prior to 11:59 p.m. the Monday after puzzles are released. At the end of each quarter, I’ll 👑 crown 👑 the finest of Fiddlers. If you think you see a mistake in the standings, kindly let me know.
Last Week’s Fiddler
Congratulations to the (randomly selected) winner from last week: 🎻 Eric Farmer 🎻 from Columbia, Maryland. I received 55 timely submissions, of which 43 were correct—good for a 78 percent solve rate.
The Fiddler Baseball League consisted of exactly two teams of equal skill: the Algebraists and the Geometers. Over the course of a season, these two teams played each other 162 times. Each team had an equal chance of winning each game, and the results of games were independent of one another.
At the end of the season, on average, how many games would you have expected the team with the better record to have won? (If the teams had the same record, i.e., 81 wins and 81 losses, then the “better” record was 81 wins.)
Suppose the teams were A and B. The number of games won by A was a binomial distribution. More specifically, the probability that team A won exactly k games was (162 choose k) / 2162. Thus, the average number of games won by A was the sum of k · (162 choose k) / 2162, for k ranging from 0 to 162. This sum came to … exactly 81. Of course! Because the teams were equally skilled, you’d expect A and B to each win 81 games on average.
But the problem wasn’t asking for the expected number of games won by either team, it was asking for the expected number of games won by the team that won more games. For example, in the event A won 71 games, which happened with probability (162 choose 71) / 2162, then the number of wins to include in the expected value calculation was 91 (the number of games won by B). Thus, you wanted the sum of max(k, 162−k) · (162 choose k) / 2162, for k ranging from 0 to 162.
At this point, solvers Michael Montuori and Mark Goodrich jumped to spreadsheets to compute the summation. That said, you could manipulate the expression inside it to remove the “max” function, giving you 81 · (162 choose 81) / 2162 plus the sum 2k · (162 choose k) / 2162, for k ranging from 82 to 162. With a little combinatorial cleverness, you could show that the latter sum was equal to 81, giving you 81 · (162 choose 81) / 2162 + 81, which was approximately 86.07.
Solver Eric Farmer wasn’t intimidated by the vast power of 2 in the denominator, and came up with a precise rational answer: 62895632625904371267814341812263929371665856338413 / 730750818665451459101842416358141509827966271488.
Meanwhile, solvers like “Maths ForFun,” Tom Singer, and Benjamin Phillabaum noted that 81 was a fairly large number, and so the first term could could be approximated by the limit of N · (2N choose N) /22N as N went to infinity, or √(N/𝜋). That meant a decent approximation was 81 +√(81/𝜋), or 86.078.
And so, on average, the better team recorded roughly 86.07 wins. Since this result was fairly close to a whole number, I accepted any solution between 86.0 and 86.1, inclusive.
Last Week’s Extra Credit
Congratulations to the (randomly selected) winner from last week: 🎻 Tyler D 🎻 from Los Angeles, California. I received 29 timely submissions, of which 26 were correct—good for a 90 percent solve rate.
After some expansion, the Fiddler Baseball League boasted 30 teams. Over the course of a season, each team played every other team five times. (Thus, each team played a total of 145 games.) As before, each team had an equal chance of winning each game, and the results of games were independent of one another.
At the end of the season, on average, how many games would you have expected the team with the best record to have won? (As before, if more than one team had the same best record, then any of them could be considered to have the “best” record.)
